Landsea ranked 15th among the top 20 listed real estate companies in 2018, and received full marks in terms of three indicators, i.e. dynamic financial security, operational efficiency and growth potential.
Static financial security and dynamic financial security reflect the financial security status of real estate enterprises from static and dynamic perspectives respectively; operational efficiency and growth potential reflect the operation condition and strategic execution of real estate enterprises. Finally, scale effect is not only the embodiment of the comprehensive competitive strength of the enterprises, but also affects the financing ability, the ability to acquire projects and the ability to spread risk to a certain extent.
These five indicators are of great significance to the future development of enterprises. Therefore, under normal circumstances, these rankings are determined by the comprehensive strength score calculated based on the aggregate weighted score of the five indicators, each assigned a 20% weight. However, in the industry transition period, financial security underlies the survival and development of enterprises. Especially amid rising uncertainty in the future of the real estate industry, dynamic financial security becomes the foundation of sustainable survival and development of enterprises. For this reason, when the dynamic financial security score of an enterprise is below 5 points, the weight of this indicator will be increased to 40%, and the weight of each of the other four indicators will be reduced to 15% accordingly.
Rankings by Indicator
The static financial security of an enterprise is measured by the short-term risk position and the overall leverage ratio (net debt ratio). Positive short-term risk position indicates that the companys cash in treasury and anticipated payments receivable in the next year are sufficient to support day-to-day operations and cover debts (including on- and off-balance sheet liabilities), while negative short-term risk position indicates that the companys cash in treasury and anticipated payments receivable in the next year are insufficient to cover debts, resulting in short-term funding gap.
The "dynamic financial security" indicator consists of three sub-indicators, i.e. "interim risk position", "interest expense ratio" and "term structure gap". Interim risk position, as an aggregate indicator, measures whether the company will face excessively large funding gap and refinancing pressure in the next 2-3 years when being hit by downturn and whether the debt ratio will further rise. Term structure gap, as a structural indicator, measures whether the capital structure of the enterprise (including short-term liabilities, long-term liabilities, and arrangements of trusts, funds, bonds and other financing instruments) is reasonable, that is, whether the debt maturity is too short or the short-term debt ratio is too high relative to the investment recovery cycle of the enterprise. Interest expense ratio, as an early warning indicator, measures the debt refinancing ability of the enterprise under the current efficiency level and financing cost, that is, whether its operating cash is enough to cover interest expense, and whether the model of operation backed by liabilities can continue.

With the operating profit margin ((operating profit + financial expenses - investment income – income from changes in fair value)/operating income) as the horizontal axis, and the stock assets turnover rate ((the contract sales amount of the real estate development business + other business income)/total assets at the beginning of the year) as the vertical axis, by identifying the position of the major listed real estate companies in the two-dimensional plan, connecting the enterprises with the highest turnover rate under the same profit margin, one can determine the “efficiency frontier” of the real estate enterprises, i.e. the enterprises with the highest turnover rate in the industry under the same profit margin, or the enterprises with the highest profit margin under the same turnover rate. These enterprises represent the highest efficiency level of domestic real estate companies. With their turnover rate as the boundary, the gap between other real estate companies with identical positioning and the frontier efficiency indicates their efficiency level in the industry.
The degree of financial leverage measures the extent to which an enterprise can further increase its debt financing given the current efficiency level and financing cost, and the extent to which an enterprise can accelerate growth by virtue of external debts. Sustainable endogenous growth rate is the endogenous growth rate of an enterprise after eliminating excessive financial leverage. These two indicators collectively reflect the effect of two major factors (efficiency level and capital cost) that determine growth potential on an enterprise, and measure the exogenous and endogenous growth potential respectively.
The results show that among the 66 listed real estate companies with annual sales over RMB10 billion in 2017, Landsea Green Group is at the forefront of the industry in terms of the aforesaid dimensions.
TOP20 List
Table 2 shows the turnover rate, profit margin, return on investment and debt financing cost of the top 20 listed real estate companies on the rankings, as well as the average level of TOP 20 companies compared with that of listed companies.
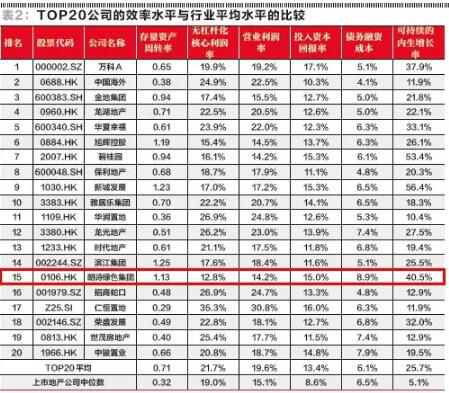
As can be seen from Table 2, the average unleveraged core profit margin of TOP 20 companies (the core profit margin without using financial leverage) was 21.7%, which was 2.7 percentage points higher than the median level of listed real estate companies (19.0%); the average operating profit margin of TOP 20 companies in 2017 reached 19.6% after deduction of the capitalized interest, which was 4.5 percentage points higher than the median level of listed real estate companies (15.1%); as for turnover rate, the average stock assets turnover rate of TOP 20 companies reached 0.71 times, which was 122% higher than the median level of listed real estate companies (0.32 times).